지난 Prometheus 설치에 이어 Grafana를 설치한다. 동일하게 helm으로 진행.
[참고] https://grafana.com/docs/grafana/latest/setup-grafana/installation/helm/
Deploy Grafana using Helm Charts | Grafana documentation
Thank you! Your message has been received!
grafana.com
설치
Helm repository 추가
[ec2-user@ip-10-180-16-34 ~]$ helm repo add grafana https://grafana.github.io/helm-charts
"grafana" has been added to your repositories
[ec2-user@ip-10-180-16-34 ~]$ helm repo update
Hang tight while we grab the latest from your chart repositories...
...Successfully got an update from the "aws-ebs-csi-driver" chart repository
...Successfully got an update from the "grafana" chart repository
...Successfully got an update from the "prometheus-community" chart repository
Update Complete. ⎈Happy Helming!⎈
Grafana 설치
namespace는 기존 Prometheus를 설치한 monitoring으로 진행한다.
[ec2-user@ip-10-180-16-34 ~]$ k get namespace
NAME              STATUS   AGE
default           Active   12d
kube-node-lease   Active   12d
kube-public       Active   12d
kube-system       Active   12d
monitoring        Active   22h
최적화
values.yaml 파일(https://github.com/grafana/helm-charts/blob/main/charts/grafana/values.yaml)을 다운로드 받아 필요한 부분을 수정한다.
#AS-IS
..생략..
persistence:
  type: pvc
  enabled: false
  # storageClassName: default
  accessModes:
    - ReadWriteOnce
  size: 10Gi

#TO-BE
persistence:
  type: pvc
  enabled: true
  storageClassName: prometheus
  accessModes:
    - ReadWriteOnce
  size: 1Gi
설치
[ec2-user@ip-10-180-16-34 ~]$ helm install -f grafana_value.yaml grafana/grafana -n monitoring --generate-name
NAME: grafana-1710984949
LAST DEPLOYED: Thu Mar 21 01:35:51 2024
NAMESPACE: monitoring
STATUS: deployed
REVISION: 1
NOTES:
1. Get your 'admin' user password by running:

   kubectl get secret --namespace monitoring grafana-1710984949 -o jsonpath="{.data.admin-password}" | base64 --decode ; echo


2. The Grafana server can be accessed via port 80 on the following DNS name from within your cluster:

   grafana-1710984949.monitoring.svc.cluster.local

   Get the Grafana URL to visit by running these commands in the same shell:
     export POD_NAME=$(kubectl get pods --namespace monitoring -l "app.kubernetes.io/name=grafana,app.kubernetes.io/instance=grafana-1710984949" -o jsonpath="{.items[0].metadata.name}")
     kubectl --namespace monitoring port-forward $POD_NAME 3000

3. Login with the password from step 1 and the username: admin
Grafana 설치 확인
아래와 같이 grafana Deployment가 추가되고 pod가 Running 상태인 점 확인.
[ec2-user@ip-10-180-16-34 ~]$ k get all -n monitoring
NAME                                                                READY   STATUS    RESTARTS      AGE
pod/grafana-1710984949-55788f87cf-47vtv                             1/1     Running   0             3m20s
..생략..

NAME                                                     TYPE        CLUSTER-IP      EXTERNAL-IP   PORT(S)    AGE
service/grafana-1710984949                               ClusterIP   10.108.8.16     <none>        80/TCP     3m20s
..생략..

NAME                                                           READY   UP-TO-DATE   AVAILABLE   AGE
deployment.apps/grafana-1710984949                             1/1     1            1           3m20s
..생략..

NAME                                                                      DESIRED   CURRENT   READY   AGE
replicaset.apps/grafana-1710984949-55788f87cf                             1         1         1       3m20s
..생략..
서비스 확인
아래와 같이 k8s port-forwarding을 통해 Local 에서 접근할 수 있도록 설정.
[ec2-user@ip-10-180-16-34 ~]$ k port-forward svc/grafana-1710984949 3000:80 -n monitoring
Forwarding from 127.0.0.1:3000 -> 3000
Forwarding from [::1]:3000 -> 3000
http://localhost:3000/ 접속 후, admin 계정에 패스워드는 아래 출력된 결과를 입력하여 접속.
[ec2-user@ip-10-180-16-34 ~]$ k get secret --namespace monitoring grafana-1710984949 -o jsonpath="{.data.admin-password}" | base64 --decode ; echo
S2xK120DgRuyNHXiwwCrc8wI5br7xuxwLE2PRbF0
화면 결과
아래와 같이 서비스 정상 접속이 확인된다.

Dashboard 추가
Data source 설정
전에 설치한 prometheus Data source를 추가한다. Connection 정보에 설치한 prometheus의 service 정보를 기입한다.

Dashboard 추가
수작업으로 Dashboard 구성도 가능하나, 간단히 아래 링크에서 원하는 Dashboard를 검색해서 import 진행
https://grafana.com/grafana/dashboards/?search=kubernetes+node
Dashboards | Grafana Labs
Thank you! Your message has been received!
grafana.com
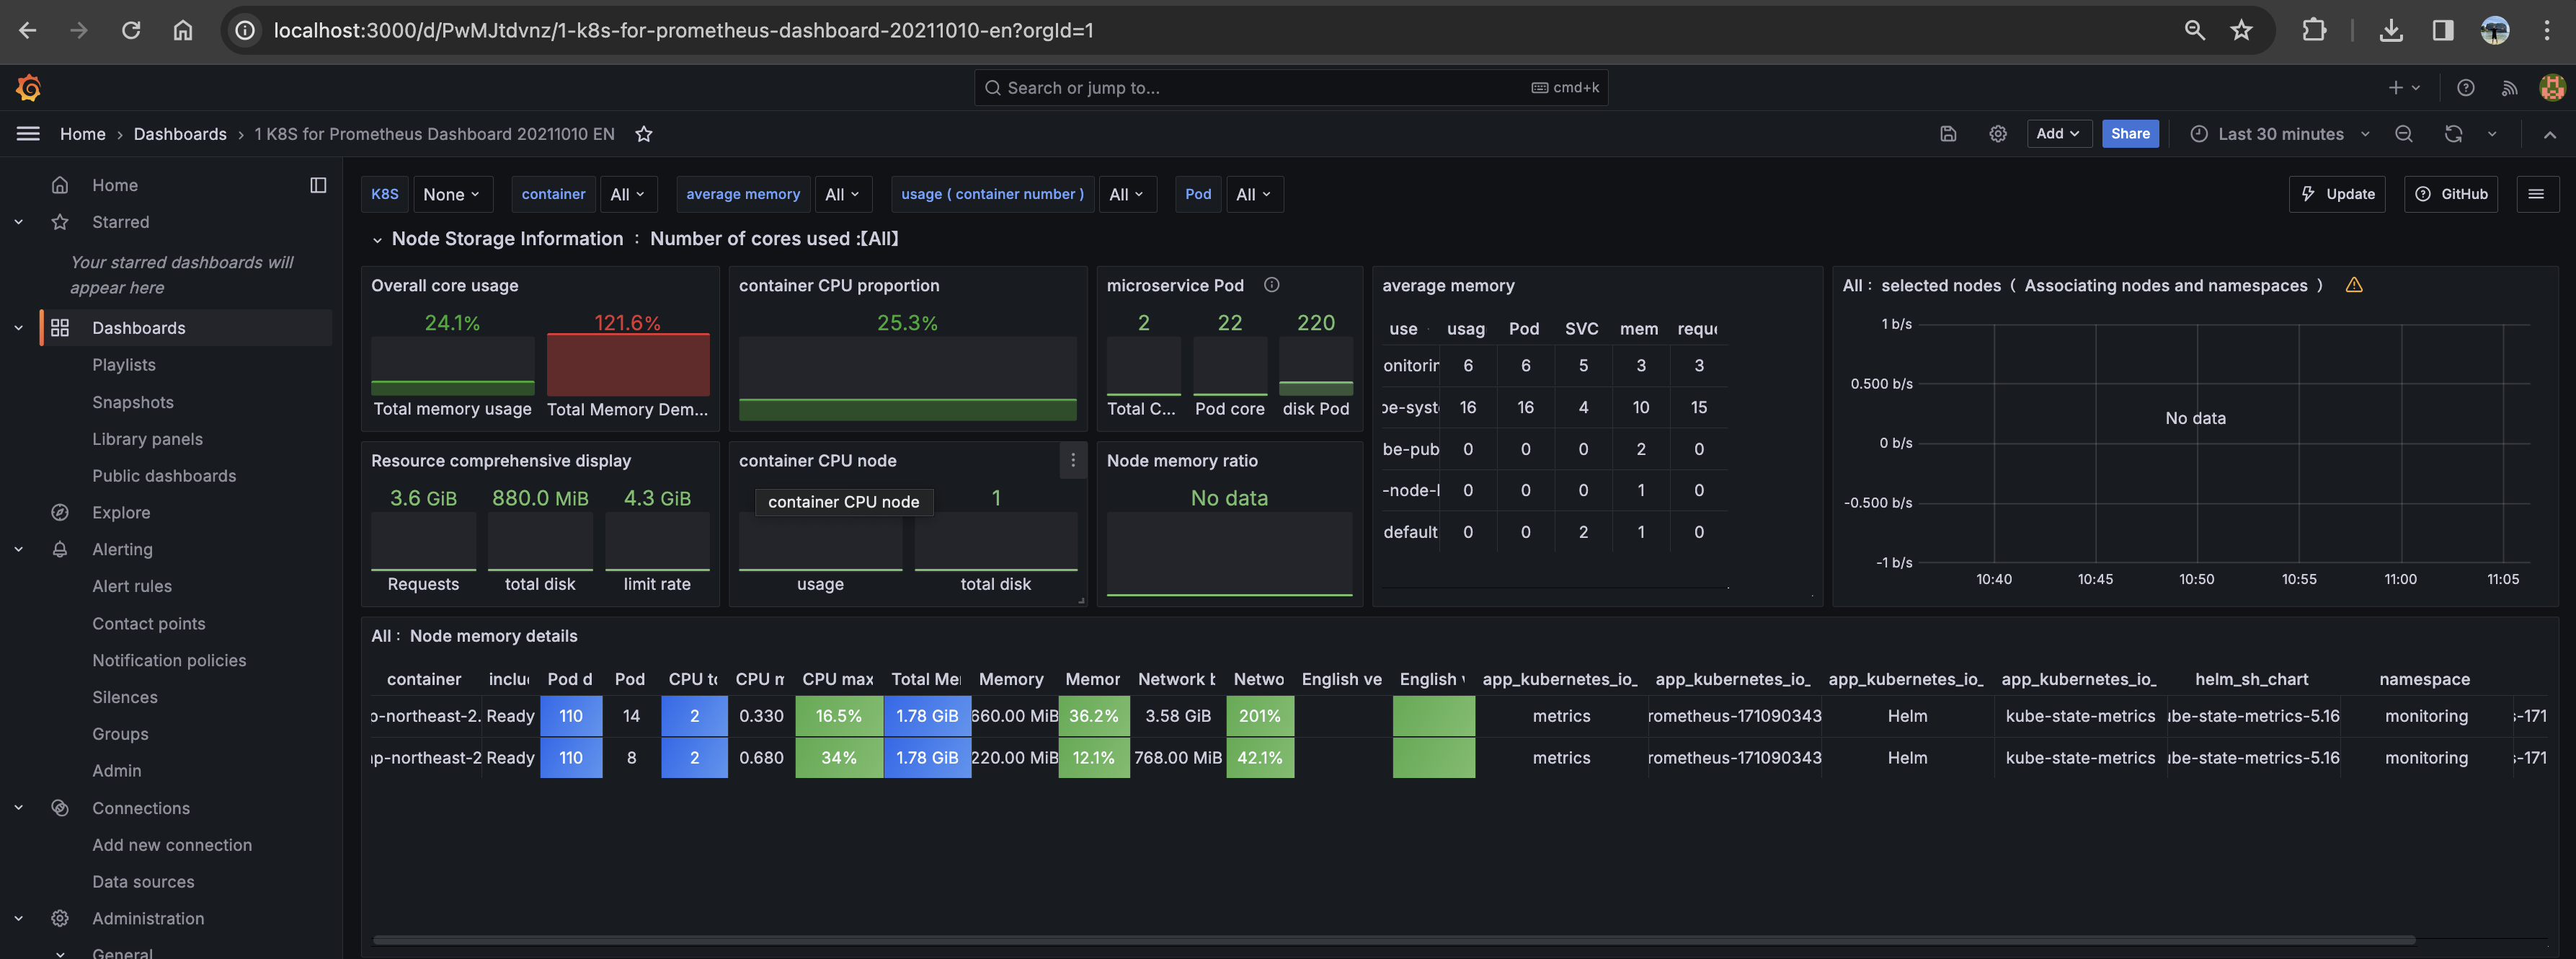
사전 설정한 Data source를 선택한 후, 최종 Import를 진행하면 Prometheus로 수집된 metric을 Grafana를 통해 Visualize 가능하다.

위와 같이 작업하여 출력된 Dashboard의 모습은 아래와 같다. 이제 시각화된 화면을 통해 monitoring이 한결 수월한 환경이 준비되었다.
'Engineering > DevOps' 카테고리의 다른 글
| Tekton 설치(minikube) (0) | 2024.06.11 |
|---|---|
| Gradle 적용 및 Maven과 비교 (0) | 2024.04.25 |
| Prometheus 설치 (kubernetes/aws) (0) | 2024.03.20 |
| npm package Nexus bulk upload (0) | 2023.08.30 |
| private Nexus로 npm repository 관리하기 (0) | 2023.08.29 |